Here are some of the strongest insights and trends that stand out from this infographic:
Key Insights from the Air Force Enlisted Promotion Rate Summary
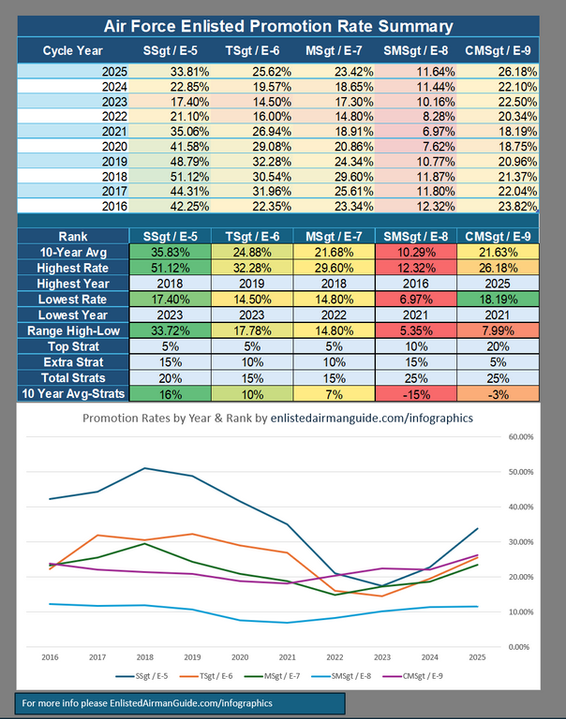
1. Promotion rates sharply declined after 2018–2019
The data shows a major contraction in promotion opportunity beginning around 2020–2023.
-
SSgt dropped from a peak of 51.12% (2018) to 17.40% (2023)
-
TSgt fell from 32.28% (2019) to 14.50% (2023)
-
MSgt declined from 29.60% (2018) to 14.80% (2022)
2. SSgt has the most volatility
SSgt promotion rates fluctuate dramatically compared to higher ranks.
-
Highest: 51.12%, Lowest: 17.40%, Range: 33.72%
This means junior enlisted promotions are highly sensitive to:
-
Recruiting levels, Retention, Manning shortages, & Force shaping initiatives
3. SNCO promotions are far more stable
Senior ranks fluctuate much less. Example: SMSgt range is only 5.35% & CMSgt range is 7.99%
This reflects: Controlled Congressional end-strength limits, Fixed leadership requirements, Smaller promotion pools, Long-term force planning
4. Stratification becomes dramatically more important at higher ranks
Estimated total stratification access:
-
SSgt: ~20%, TSgt/MSgt: ~15%, SMSgt/CMSgt: ~25%
But the promotion averages tell a deeper story: At SNCO levels, stratifications become one of the strongest differentiators because promotion opportunity is extremely constrained.
5. CMSgt behaves differently than the other ranks
Chief rates remain relatively high and stable compared to SMSgt.
-
CMSgt average: 21.63% vs. SMSgt average: 10.29%
This suggests the biggest bottleneck in the enlisted force may actually be the jump from MSgt → SMSgt rather than SMSgt → CMSgt. In other words: Becoming a Senior may statistically be harder than becoming a Chief.
6. The Air Force appears cyclical
The graph suggests promotion rates follow broader force-management cycles:
-
Expansion periods → higher promotion rates, Stabilization periods → lower promotion rates, Recovery periods → rates rebound
This mirrors: Budget cycles, Retention swings, Recruiting success/failure, Operational demand, Congressional force sizing
7. The infographic indirectly shows why timing "luck" matters in careers
An Airman testing in: Example 2018 had drastically different odds than someone testing in 2023, despite potentially equal performance